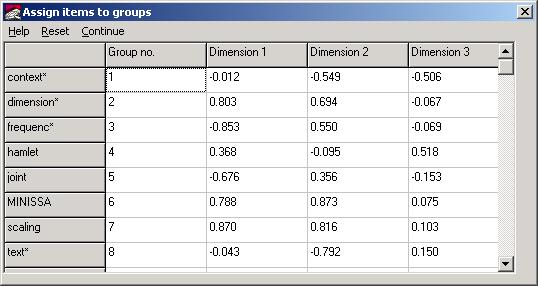
The data items from a MINISSA output file selected are displayed in a spreadsheet, as follows:
You can select clusters by first performing a hierarchical
cluster analysis and carrying forward
the allocations for a chosen minimum level of similarity.
Otherwise, when the values are first displayed, each item is
numbered separately. You can assign items to
hypothetical clusters by entering group numbers
in the column headed Group no.
Clicking on Continue, to close the spreadsheet window, will add the means of the groups entered to the existing plot, and display an analysis of variance of the specified clusters.